
Pranjal Samant. I am a Robotics Systems Engineer focused on solving real world engineering problems.
For this project, I developed a “Drone-in-a-Box” (DiB) system using the PX4 Autopilot stack and Gazebo Harmonic. The machine is a quadcopter based on the x500 airframe, which I customised with specialised aerodynamic plugins (AirDrag and Lift-Drag) so that environmental forces like wind are not just visual effects, but physical disturbances the flight controller must actively fight.
The "Drone-in-a-Box" market is projected to reach $3.48B by 2030 (Fortune Business Insights), yet a massive bottleneck remains: aviation regulations still require a qualified remote pilot to oversee most autonomous docks. While the takeoff and landing are autonomous, the safety oversight is not. The FAA's BVLOS rule (Part 108) is still not final as of July 2026, and the best available relief — the one-to-many waiver — caps a single remote pilot at four aircraft. Nobody can vouch for the aircraft's internal health mid-flight.
I set out to prove that RideScan can act as that “independent safety layer,” detecting silent hardware degradation like a motor losing thrust that standard flight controllers usually hide through aggressive PID compensation until the moment of a catastrophic crash.
My integration strategy focused on data integrity and high-frequency precision. I bypassed standard ROS 2 topic scraping for the core telemetry and instead used MAVSDK-Python to pull data directly from the PX4 Flight Controller's MAVLink bus at 50 Hz.
I mapped the drone's Extended Kalman Filter (EKF) outputs to the RideScan DRONE schema:
The 0.5 m AGL trigger. To comply with RideScan's requirement for positive altitude (z_m > 0), I engineered a “Schmitt trigger” in the logging script. Recording only initiates once the drone passes 0.5 metres during takeoff, and terminates immediately upon descent below 0.5 metres. This eliminated ground-effect noise and landing-gear compression data that would have “poisoned” the calibration baseline.
Lean communication architecture. I hit a limitation where connecting multiple MAVLink scripts (Brain, Logger, HUD, Wind Service) saturated the drone's serial ports, causing heading estimate failures. I re-engineered the stack into a hybrid model: the Mission Brain remains the primary MAVLink link, while other nodes consume position and phase data via a high-speed ROS 2 Humble backbone.
Beyond the MVP. I built a custom Ground Control Station (GCS) using Tkinter and OpenCV. It features a split-screen view with a primary navigational feed and a nadir (downward) picture-in-picture feed. It also includes an automated 15-run batch controller and a “RideScan Validator” that audits every CSV file against the technical spec before the drone even disarms.
I ran two distinct fault classes against a 15-run “healthy” baseline, calibrated at a still 0.1 m/s wind.
I injected a 25% thrust derate on Rotor 0. To the naked eye in simulation the drone looked perfect; the PX4 controller simply tilted the drone more to compensate. However, the RideScan RISQ score told the real story. The score rose monotonically from a baseline of 1.50 to 51.69 over 10 runs. Because the score never returned to the “healthy” band, it indicated a persistent hardware failure. (See figure 3 for the graph)
Verdict: ground the aircraft and swap the motor.
I introduced a weather front where wind built from 0.1 m/s to 12 m/s and then cleared. This caused a massive spike in the RISQ score, peaking at 93.79 — nearly double the motor fault. Crucially, as the wind cleared, the score returned to the healthy baseline (2.10). (See figure 4 for the graph)
Verdict: no maintenance required; the aircraft is healthy, the environment was the anomaly.
This proved that RideScan doesn't just bark at errors — it distinguishes between a dying robot and a bad day at the office.
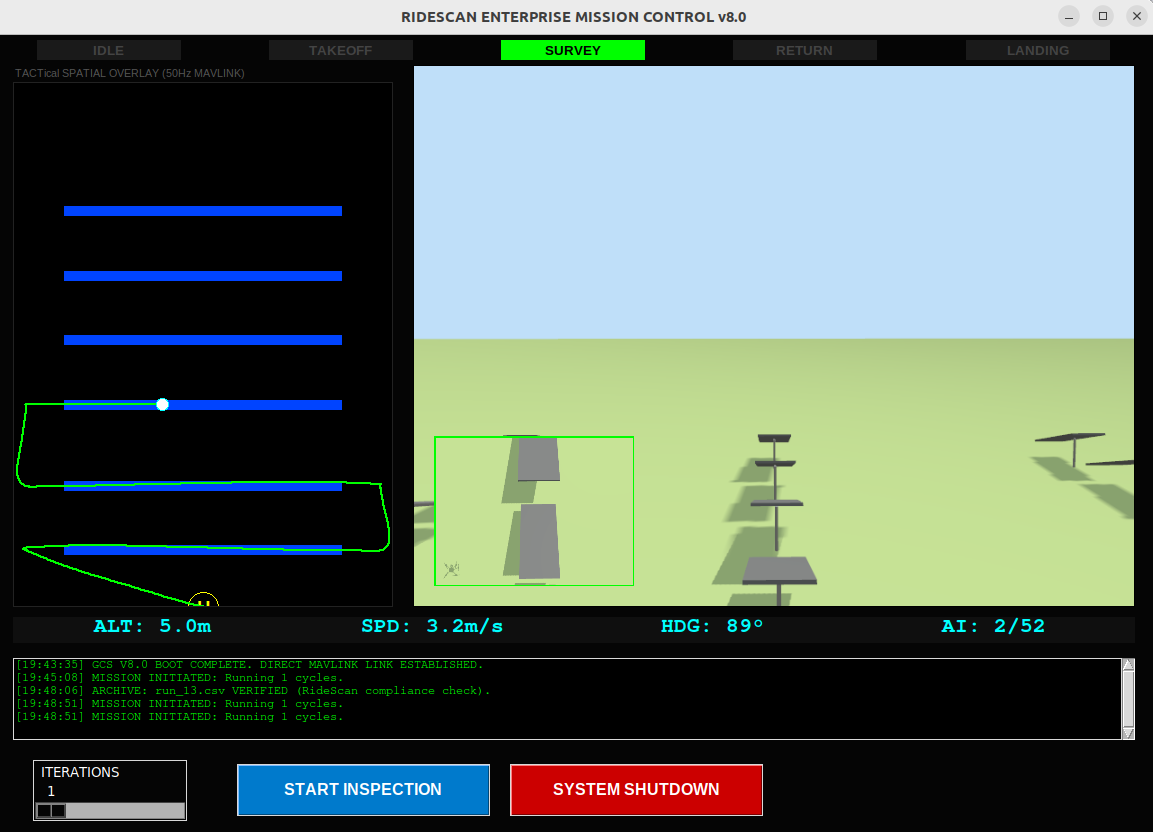
Figure 1 (Drone Dashboard)
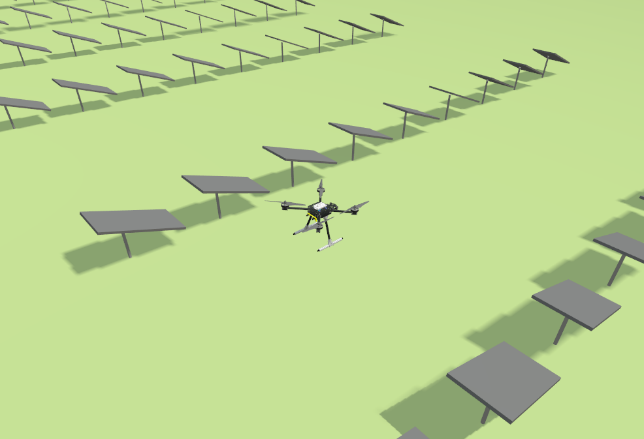
Figure 2 (Drone flying in Gazebo Sim)
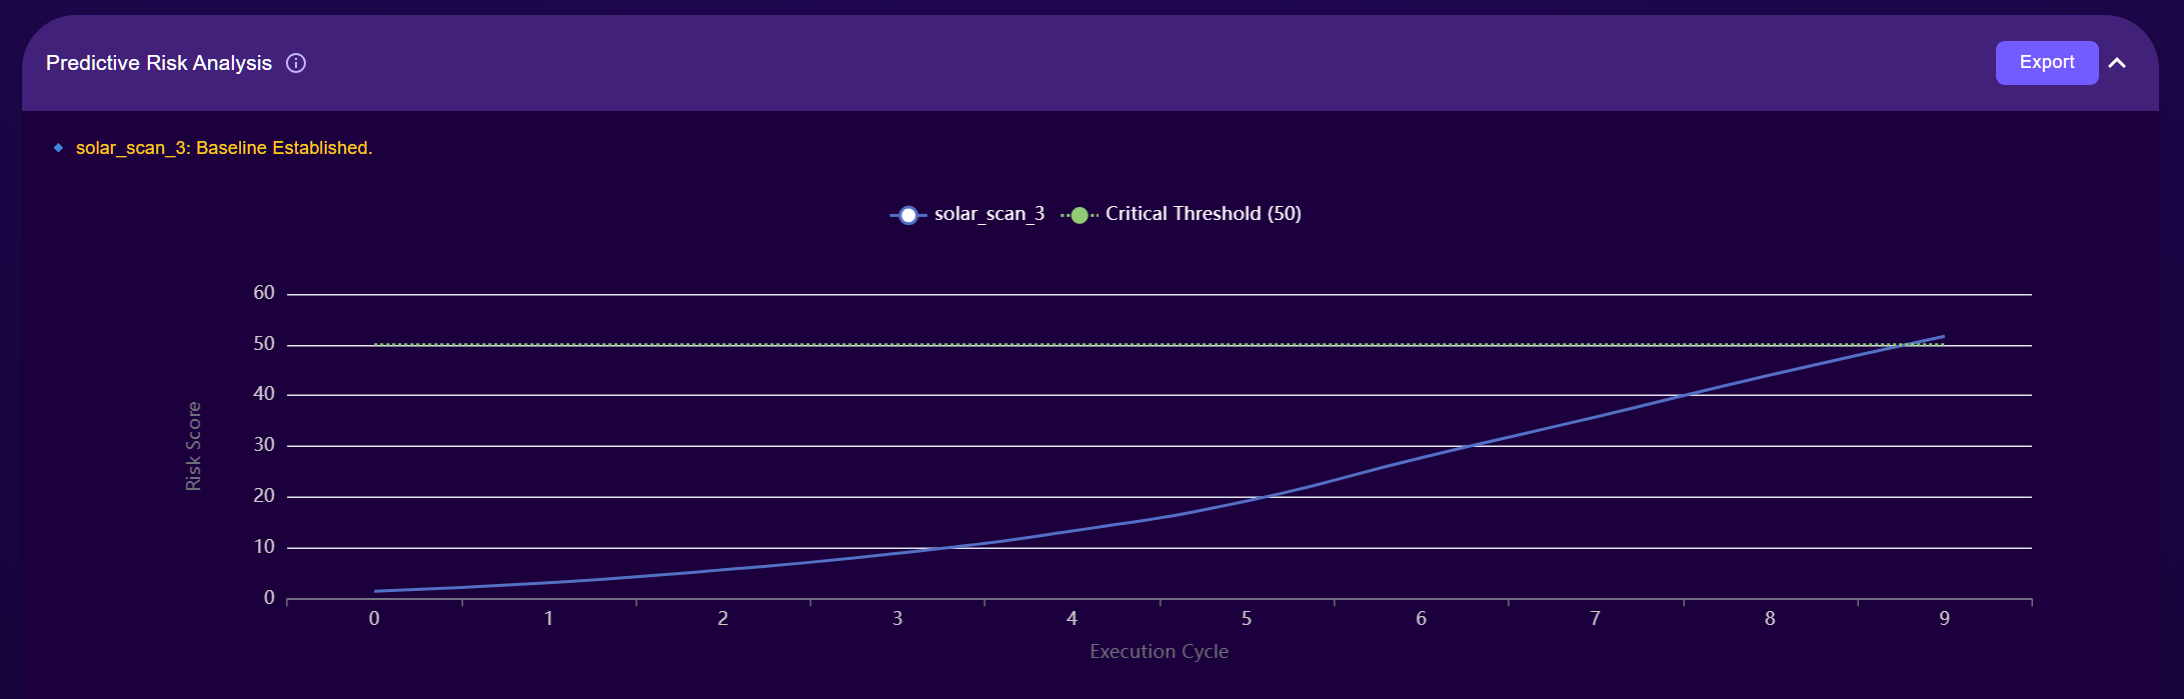
Figure 3 (Motor failure graph)

Figure 4 (Wind graph)
The biggest challenge was the “invisible failure” problem. Modern flight controllers are too good at hiding faults. In early trials my AirDrag area was set too low, meaning the drone didn't have to “lean” enough into the wind to maintain its path. The simulated telemetry needed to reflect the drone's physical compensation for RideScan to observe the resulting behavioural change. I had to tune the aerodynamic cross-section of the digital twin to match real-world physics so the telemetry actually reflected the motor strain.
I also learned that ROS 2 latency can be an issue for safety-critical logging. Moving the RideScan Logger to a dedicated MAVSDK port was the only way to ensure the strictly monotonic timestamps required for a successful upload.
The project successfully demonstrated an end-to-end safety pipeline for Drone-in-a-Box operations. By establishing a high-fidelity calibration baseline, I was able to automate the “Go / No-Go” decision for re-flights.

