
Sharanya, Computer Science graduate from IIT Bombay. I worked with a Unitree G1 humanoid simulated in MuJoCo, building the inspection mission, telemetry pipeline, and RideScan integration on top of an existing robot platform rather than building the robot from scratch. I used pretrained ONNX reinforcement-learning policies for walking, crouching, and reaching, which let the mission produce realistic simulated joint and sensor telemetry for calibration. I chose the G1 because its 29 joints make it one of the toughest robots to monitor: a small actuator fault can cascade through the whole body. It is also commercially relevant because a humanoid can operate in human-designed industrial facilities and inspect equipment without major infrastructure changes.
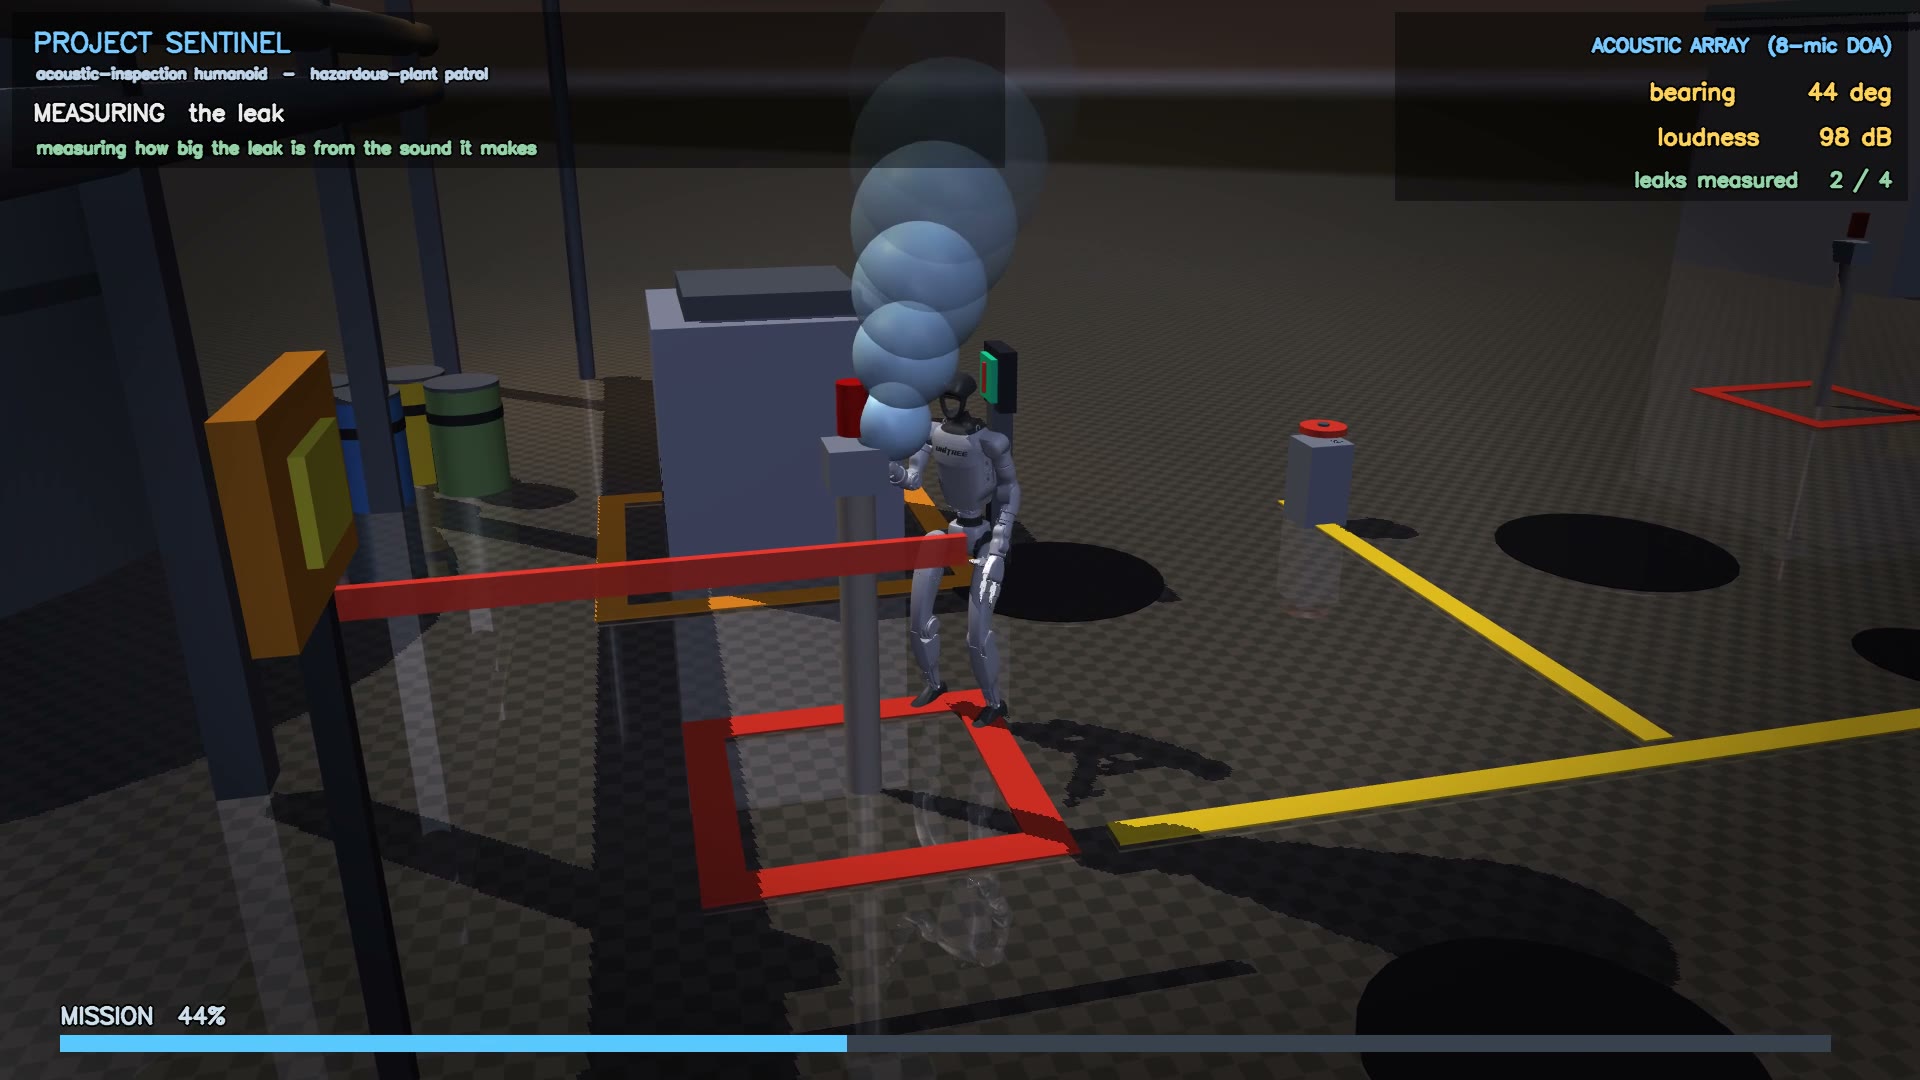
The robot runs an autonomous acoustic leak-inspection patrol through a hazardous gas-processing plant. Using an 8-mic acoustic array, it listens outward for gas leaks while walking a fixed route; when it hears a leak, it turns and diverts toward that source before continuing the patrol. The mission makes it turn between stations, step up onto an inspection platform, reach to read gauges, and deep-crouch to check valves before returning to dock. Safety monitoring matters because nobody can rescue the unit mid-patrol, a failing humanoid near live equipment becomes a new hazard, and finishing the route is not the same as being healthy: the robot can complete every station while an actuator quietly wears out.
Mapped the G1 MuJoCo stack onto RideScan's hierarchy: Robot → Mission → Mission Instance → Calibration → Inference. Registered the robot as Sentinel and the leak-inspection patrol as the mission. Saved each run as one CSV mission instance. Upload path: fifteen healthy files as calibration → call calibrate → upload stressed files as process files → call process → read risk scores.
MuJoCo with a fixed seed can replay the same motion byte for byte. That is great for repeatability, but a zero-variance baseline is unrealistic for sensors. So I kept the path locked and applied a per-run sensor model only to how sensors report that path. Noise effects included: bias/scale error, axis misalignment, slow drift, saturation, quantization, pose latency, timestamp jitter, and short torque lag (~5 ms). Magnitudes follow component datasheets (BMI088-class IMU, 14-bit encoders, motor-current torque, load-cell feet), and each effect was checked in the CSV outputs before calibration.
What I did: kept the same patrol and scaled noise on all sensors together (0.2× to 2.5×).
Observation: as overall sensor noise went up, the risk score went up in order (3.72 → 40.3). The robot still finished the route every time, so the score is tracking signal health, not mission completion.
| Noise level | Multiplier | Risk score |
| Very Clean | 0.2× | 3.72 |
| Low | 0.5× | 9.26 |
| Medium-Low | 0.8× | 13.74 |
| Moderate | 0.9× | 16.33 |
| Baseline | 1.0× | 18.14 |
| Medium-High | 1.2× | 22.25 |
| High | 1.5× | 26.4 |
| Very Noisy | 2.0× | 33.77 |
| Extreme | 2.5× | 40.3 |
What I did: stressed only IMU, or only torque, or only joint encoders/residuals, or only latency, or a mixed case. First at about 2× intensity, then again at 5×.
In plain terms: the robot still walked the same route; I only made selected sensor columns in the CSV noisier or more delayed (IMU readings, torque readings, joint angle/velocity/residuals, or pose timing), so the score reacts to measurement quality, not a changed mission.
At about 2×, scores sat in a narrow band (roughly 9.8 to 13.7). Differences across sensing classes were hard to read. At 5×, the picture was clear:
Observation: for this humanoid patrol, joint-channel problems dominate. Corrupting joint feedback alone pushed risk near 43, while IMU, torque, and latency stayed near 3.
| What was stressed | Risk score |
| Torque only | 2.93 |
| IMU only | 2.94 |
| Latency only | 2.96 |
| Mixed (IMU + torque + latency) | 2.96 |
| Joint encoders / residuals only | 43.03 |
What “family ablation” means in plain terms: I keep the same mission, but I add strong noise to only one group of joints at a time (for example only the ankles), and leave the other joints alone. That shows which body region the risk score cares about most. At 5× joint-channel noise:
Observation: which family fails matters. Ankles (4 joints) scored higher than hips (6 joints), so it is not only “more joints = more risk.” On a biped, distal support joints can matter a lot.
| Joint family | How many joints | Risk score |
| Knees | 2 | 3.95 |
| Hips | 6 | 14.43 |
| Ankles | 4 | 22.47 |
| Waist | 3 | 23.1 |
| Arms | 14 | 24.62 |
What I did: used the same per-joint noise, but increased how many joints were corrupted: 1 → 3 → 6 → 12 → all 29.
Observation: risk rises as more of the body is corrupted. Full-body joint corruption (~43) matches the all-joint subsystem result from Experiment 2.
| Joints corrupted | Risk score |
| 1 (left ankle pitch) | 4.82 |
| 3 (left ankle + knee) | 15.73 |
| 6 (full left leg) | 19.54 |
| 12 (both legs) | 26.84 |
| 29 (full body) | 43.09 |
With the same policy and seed, MuJoCo can produce byte-identical telemetry every run. That is why I added data sheet-like sensor noise: to make the baseline closer to real sensor reporting. Even then, the sim does not account for weather, facility radio dropouts, mounting flex, true ultrasonic plant acoustics (I use an in-band proxy), or on-robot compute jitter on real hardware.
I also did not know in advance which sensor-noise range to use. I validated magnitudes from component references (Bosch BMI088-class IMU, 14-bit absolute encoders, motor-current torque estimates, and load-cell foot sensors) and used those data sheet-grounded values in the sensor model rather than picking noise levels at random.

